

Invest
Diversify with private credit and equity real estate investment funds that make non-concessionary impact investments to expand access for America’s working families to affordable, safe communities.
Compare Funds
Articles
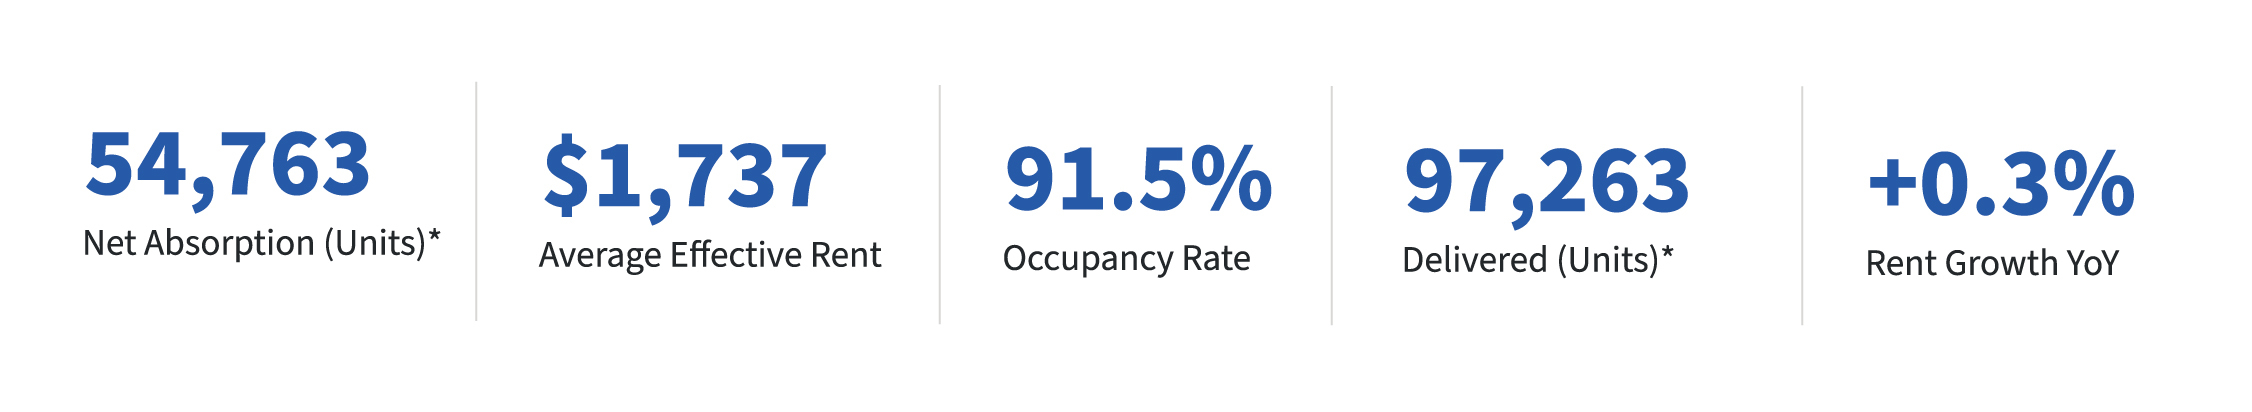
Take a look at Q4 2025 by the numbers.
January 31, 2026
Market Updates
Following a period of volatility and supply-side pressures, the U.S. multifamily market could be showing signs of early-cycle normalization.
The biggest catalyst this quarter was arguably the Federal Reserve’s pivot toward easing, beginning with its initial rate cut in the second half of 2025.1 While the federal funds target range now sits at 3.50%–3.75%1, the more immediate impact has been a shift in sentiment, with long-term capital increasingly viewing peak monetary tightening as likely behind us.
Improving alignment between buyers and sellers on pricing could support a gradual thaw in transaction activity and help stabilize valuations going forward, with a plurality of market participants surveyed by CBRE already anticipating multifamily cap rate compression (i.e. rising valuations) come 2026.2
Market fundamentals likewise appear healthy. Annual net absorption exceeded 434,000 units in 2025, placing leasing activity well above the historical 10-year average. Meanwhile, 521,000 units were delivered in 2025, though a weakening construction pipeline could spell sharply lower supply in subsequent quarters.3
High home prices and elevated mortgage rates continue to make renting more affordable than homeownership in many major markets, sidelining would-be buyers.6 Despite the Fed’s rate cuts, mortgage rates remained in the 6.0%–6.5% range in Q4 2025, finishing the year with an average rate of 6.15%,4 while the national median home price—at roughly $433,000 according to Redfin–has remained near all-time highs amid constrained inventory.5
As a result, average monthly payments—consisting of mortgage payments, property taxes, and homeowners insurance costs—are now more expensive than rent in every one of the country’s 50 largest metro areas,6 effectively limiting the natural outflow of renters into homeownership and sustaining demand for multifamily housing. In fact, the average first-time homebuyer is now 40 years old—the oldest ever.7
This comes at a time when the supply pipeline is waning. Multifamily units under construction dropped by more than 50% between Q4 2022 and Q4 2025, falling from roughly 729,641 to 327,262 units.8 As construction activity and deliveries continue to wane, this could result in an environment where demand exceeds new supply.
If supply outpaces demand over the coming quarters, occupancy rates could rise—and vacancies could fall. Currently, the national vacancy rate is expected to decline from 8.5% at year-end 20253,* to 7.9% by the end of 2026,8 which could result in a more favorable leasing environment. Although nationwide rents grew just 0.3% on a YoY basis in Q4 2025,3 this environment sets the stage for renewed rent growth acceleration in 2026, with forecasts estimating increases of 2.3%.9
DLP projects that 2026 will mark the beginning of a new compression cycle on capitalization rates, driven by increased liquidity from buyers. We believe that financing costs will reduce significantly over the coming 12 months, with the Federal funds rate and SOFR projected to decrease to the low 3% range.10 This reduction in debt cost is expected to drive increased cash flow and value increases, potentially resulting in 10-13% asset value appreciation over the coming year and an increase of over 20-30% in equity values as cap rates compress and occupancy rises.3
DLP also expects a return to positive, normalized rent growth as the current supply wave is absorbed and occupancy rebounds to historical levels. Absorption is projected to begin outperforming deliveries, allowing markets to stabilize. We anticipate that NOI will improve, driven by revenue increases resulting from rent growth and lowered concessions. We expect NOI improvements will also be bolstered by the ongoing flattening of inflation for operating expenses, especially with payroll, maintenance, and turnover costs. In the single-family market, DLP forecasts a period of slow repair and incremental normalization from 2026 to 2028, creating a Golden Ratio where wage growth modestly outpaces home price growth, improving affordability.
DLP expects these improved operating fundamentals and capital market conditions to impact all DLP-sponsored funds. We anticipate the DLP Housing Fund portfolio to reach 95% physical occupancy while tightening payroll and turnover expenses. The DLP Building Communities Fund is slated to move multiple assets into vertical construction, lease-up, and stabilization in 2026 and 2027, continuing to put investor capital to work to bring Thriving Communities to life.
We expect continued growth in our sponsored debt funds, the DLP Lending Fund and DLP Preferred Credit Fund, by continuing to provide financing solutions to mission-aligned real estate sponsors for attainable housing and bridge lending on lease-up properties. Overall, DLP Capital believes continuing to execute on our proven investment strategies will drive performance across the Funds, including hitting all annualized net return targets.
Our website uses cookies to enhance your experience, analyze website traffic, and deliver content tailored to your interests. By clicking "Accept", you consent to our use of cookies.